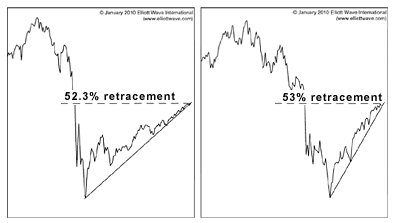
One of the above charts shows the 1929-1930 Dow. The other shows the current Dow. Can you tell which is from which?
The current chart: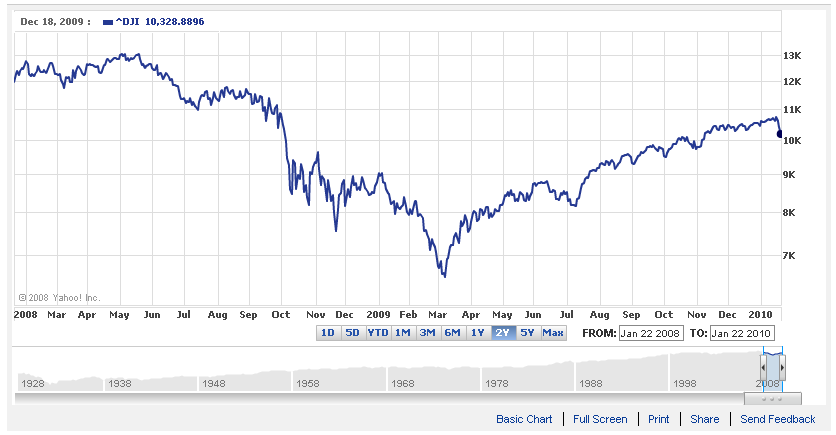
The chart during the Great Depression: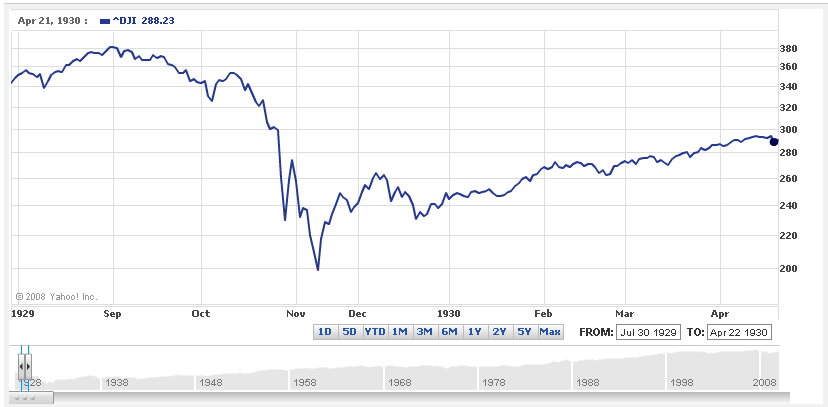
This is what happen after April 1930 bear market rally peak...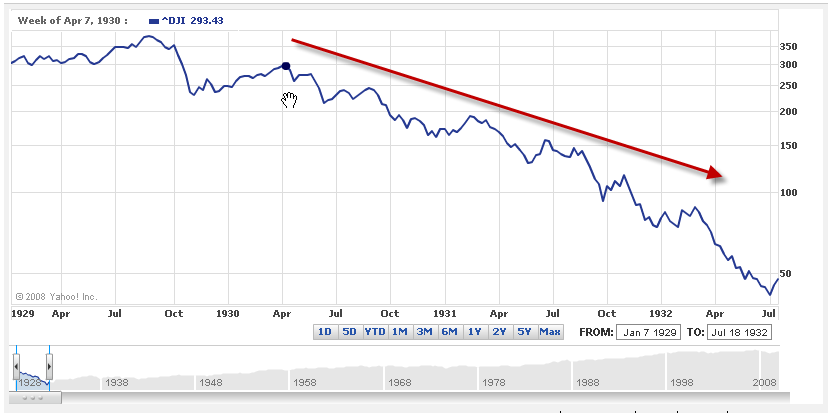
Saturday, January 23, 2010
Bear Market Rally of the Great Depression
![]()
Subscribe to:
Post Comments (Atom)


No comments:
Post a Comment